Multifamily Investments in a U.S. Gateway Market: San Francisco Bay Area
Ron E. Cruz
Published Online: 24 November 2020
Abstract
Multi-unit residential in U.S. Gateway Markets are favored investments. Well located multifamily property has the potential to hold its value better than other markets. Primary markets like the San Francisco Bay Area are blighted with the rent control, suppressing aggressive rental increases, and lowering immediate investment returns. Despite this complexity, capital from institutional investors such as real estate investment trusts (REITs), pension funds, and private equity still flow to this market, further increasing the already inflated value of property. The sentiment of favoritism on real estate investment in this market is centered around strong employment, prestige, and scarcity.

Slide 2/50 via Presentation

Slide 8/50 via Presentation
Introduction

Slide 12/50 via Presentation
Real estate is regarded as an investment vehicle that allows for further diversification within the traditional portfolio that primarily consists of stocks and bonds. Adding real estate to one’s investment portfolio allow for multiple advantages that range from residual cash flow, varying tax advantages, appreciation, and increased equity through mortgage pay down. Investment property asset classes come in a wide array, ranging from office, industrial, retail, and multifamily.
Multi-unit residential or multifamily properties are regarded as foundational investments in real estate portfolios. Since multifamily assets are a major portfolio allocation within the real estate capital markets, there is much debate as to where properties should be located. My research will be seeking to expand on why capital still flows to multifamily investment property in the San Francisco Bay Area market despite the complications of a high price premium and strict policies against aggressive rental increases.

Slide 14 / 50 via Presentation
The primary driver for values in real estate aside from specific asset class distribution is its location. Property located in rural markets tend to have lower values, allowing for a larger pool of buyers. Despite the vast availability of buyers, real estate values are also driven by the spatial demand of individuals, businesses, and opportunity relative to the marketplace. Areas with greater income earning potential and larger populations tend to have higher property values across all real estate asset classes. U.S. Gateway markets tend to have some of the highest property values, creating a dynamic that prevents most investors from entering the market and extremely compression in regard to investment returns. Despite these challenges, investment capital is still deployed netting attractive returns.
Multifamily investments in other markets pose certain risks and ramifications that are not as evident in a U.S. Gateway market such as the San Francisco Bay Area. In other words, investments in Non-U.S. Gateway markets can see higher returns for investors, but not without significant risk. As a result, the risk premium available for investors who seek to be more aggressive may not coincide with the investment strategy of those looking for consistency. Investors that are seeking safer investments, especially in turbulent markets, are willing to sacrifice aggressive returns to drastically reduce their risk exposure.

Slide 24/50 via Presentation
Many U.S. Gateway markets come with the varying complications of tenant friendly rulings such as rent control, vacancy control, or rent stabilization. Rent control in California has hindered investment capital from flowing into the market due to the inability to aggressively increase rents thus suppressing investment yield. To accommodate for challenge, investors must find new strategies to increase their yield. Investors who purchase multifamily in major markets generally are seeking the attractiveness of renters and businesses who demand proximity to centralized business districts and major areas of import or export. The demand for space and commerce within centralized business districts has historically increased in value over the long term, providing growth and foundational value to adjacent multifamily property. The marginal benefits to investment capital deployment within the San Francisco Bay Area market is primarily derived from scarcity, value appreciation, and redevelopment opportunities.
Through the utilization of various academic journals, multifamily brokerage research cohorts, and trade organizations, data was procured to support different conclusions on multifamily investment in the Bay Area. Prior research from these sources were able to analyze statistics and varying value metrics to show San Francisco Bay Area multifamily property possessing more stable returns on capital. These value metrics support the claim that San Francisco Bay Area multifamily despite the premium, can still be an investment alternative that can withstand global market volatility.
Multi-unit residential investment properties in a U.S. Gateway market such as the San Francisco Bay Area historically have subpar base investment yields in comparison to secondary and tertiary markets. Though the investment return from U.S. Gateway market properties as opposed to other market alternatives may be low, properties located in these primary markets have significantly lower volatility. Experienced owners and operators are still able to navigate the varying complications, allowing them to create value-add opportunities that smaller-scale investors are unable to utilize.
Existing Literature
To understand how and why capital flows to multifamily properties in U.S. Gateway markets, we need to first understand the metrics, methods, and drivers used to determine and establish value. Understanding the value determinants allow us to further expand on research found on the drivers of multifamily investment in the San Francisco Bay Area. The location in our research has the complexity of rent control rulings that often impede and discourage investment capital from freely flowing in.

Slide 17/50 via Presentation
Multifamily and other commercial investment properties’ values are denoted by the capitalization rate, often abbreviated as “cap rate” (Li, J. et. al, 2020). The cap rate, expressed as a percentage, is derived by dividing the net operating income (NOI) of the property by the estimated value. By utilizing the simplicity of the cap-rate valuation method, we are able to compare real estate investment properties to investment alternatives such as Treasury bills, bonds, equities, and mortgage security yields (Li, J. et al, 2020). Stocks and exchange traded funds (ETFs) tend to have higher yields but are riskier than lower return alternatives such as the U.S. Treasury bill. Similarly, an investment property with a low cap rate is generally regarded as a safer, stabilized investment, and high cap rate properties are associated with additional risks and challenges.

Slide 20/50 via Presentation
Gateway market cities serve as popular locations for real estate investment due to the quality, size, and stability properties available (Devaney, S. et. al, 2019). Investment into Gateway markets is often motivated by stringent laws in a home market or fewer overall opportunities for investment (Devaney, S. et. al, 2019). A study conducted in over 38 U.S. metropolitan statistical area (MSA) markets found that foreign investment into Gateway markets corresponded to an over 80 basis point reduction in overall market cap rates (Devaney, S. et. al, 2019). The drastic reduction in cap rap rates provide insight to investor sentiments of security within U.S. Gateway markets. As the capitalization rate compresses, the value of the property increases, but the return on investment annually gets suppressed. Utilizing a case study example, in the event a property’s capitalization rate of 5% spikes up by 100 basis points to 6%, the asset drops 17% in value (Geltner, D. et. al 2017). In that same example, a property’s cap rate decreasing by 100 basis points can equate to an increase in the property’s value by 17%. With the cap rate being an extremely sensitive measure to value, we can approach the pricings of property with a stronger, more analytical approach. Properties that have higher cap rates are denoted as opportunistic and more volatile, while properties with low cap rates are coined as stabilized and more risk averse.
Stabilized properties are generally acquired as a way to protect capital and to hedge aggressive portfolio investments (Geltner, D. et. al 2017). Stabilized assets generally do not have additional room to aggressively appreciate in value. Investment firms and funds often disregard aggressive, opportunistic real estate investments, preferring that of consistent growth through uncertain market cycles (Devaney, S. et. al, 2019). The premium on stabilized investment properties create a participation barrier making it difficult for investors with less capital to hit hurdle rate minimums for their debt and equity investors. Well-funded investment firms are able to capitalize on the reduced competition for stabilized assets by utilizing professional asset management or redevelopment opportunities to further squeeze yield from stabilized properties.
Slide 27/50 via Presentation
One of the foundational valuations to real estate is its location. If a property is in a tertiary market, it will not hold as much value as something that would be in a location with a higher population and household income. With U.S. Gateway MSAs being more well- documented and transparent with sales and asset information, well-capitalized investors are able to exploit this, strategically entering and exiting real estate investments as well as maximizing their return (Ling, D.C. et. al, 2019). Secondary and tertiary markets tend to have less sales and leasing activity, making valuation of properties opaquer. When an investment objective is to reduce risk while maximizing yield, having assets with obscure valuations can drastically increase portfolio beta. Assets located in U.S. Gateway markets provide investors with significantly reduced ambiguity, allowing for predictable investment return. With the various MSA options available for investments, the individual MSA risk exposures are determined to be a key driving factor for investment funds and fund managers (Li, J. et. al, 2020). Studies completed across 3,000 transactions in New York City revealed that foreign investors paid a significant premium than their domestic counterparts. The trends revealed from the study showed investment being concentrated on newer and larger stabilized properties (Devaney, S. et. al, 2019). Properties that are stabilized have predictable return metrics that investment managers can forecast, allowing them to be confident with their decisions.

Slide 28/50 via Presentation
Multi-unit residential properties in U.S. Gateway markets like the San Francisco Bay Area benefit from strong economic growth components. Investors such as Real Estate Investment Trust (REIT) managers, pension funds, and sovereign wealth funds have an obligation to invest in real estate with strong fundamentals. (Ling, D.C. et. al, 2019). Areas such as San Francisco are favorites for investors with a defensive investment strategy requirement as they are in proximity to multiple drivers of values. These include San Francisco’s abundance in high paying tech corporations that employ talent internationally and the abundance of venture capital, private equity, and angel investment firms. With strong fundamental drivers of values, investments in this market tend to be of higher quality to those in other locations. This creates an environment that entices international investment cohorts to enter the market, seeking safety from market volatility and to hedge riskier assets in an investment portfolio. (Devaney, S. et. al, 2019). Investors deploy capital to markets such as the San Francisco Bay Area to defend their capital and benefit from fundamental economic drivers of wealth. With set hurdle rates and mandatory return metrics to satisfy, these investors prefer predictable assets with lower beta values.
A major investment handicap found in a U.S. Gateway markets like San Francisco are the tenant friendly laws and policies. A major tenant friendly law ubiquitous within U.S. Gateway markets is rent control. Rent control limits a landlord’s ability to evict a tenant and sets strict guidelines to the amount rents can be increased. This ruling creates a dynamic where landlords prefer short-staying tenants than long-term tenants as this allows the landlord to constantly readjust rents to market rates with ease. (Basu, K. et. al, 2000). In San Francisco, landlords are incentivized to remove long term tenants under the jurisdiction on rent control given the extreme delta found between fair market rents and rents suppressed by rent control. (Diamond, R. et. al, 2019) The repositioning strategy to increase value through the removal of long-term tenants requires investors to be well capitalized to deal with the legal and public ramifications from evicting tenants. Smaller investors who own rent controlled multifamily properties are unable to capitalize on the varying methods to increase their return in a market that has rent control. Newer multifamily products or redeveloped buildings are exempt from rent control, allowing for significant upside in older properties where maintenance has been deferred. (Diamond, R. et. al, 2019) The challenge of rent control adds to the premium, restricting investors with less capital from reaping the benefits from repositioning rent-controlled buildings.
Slide 29/50 via Presentation
Properties in U.S. Gateway markets are able to command a high price due to the strong economic foundational drivers. Multifamily investments in markets such as the San Francisco Bay Area tend to have lower capitalization rates, coinciding with the narrative that investing in these properties pose lower risk. The lower cap rates also indicate that these assets tend to be stabilized with limited options to drastically change in value. The complication of rent control in the Bay Area hinder those less capitalized seeking to compete in the pursuit of multifamily investment opportunities.
Analysis from Empirical Data
The evidence, research, and data from various sources deduce strong implications in regard to property in U.S. Gateway markets are generally turn-key investments that still have additional room for value for well capitalized investors.

Slide 33/50 via Presentation
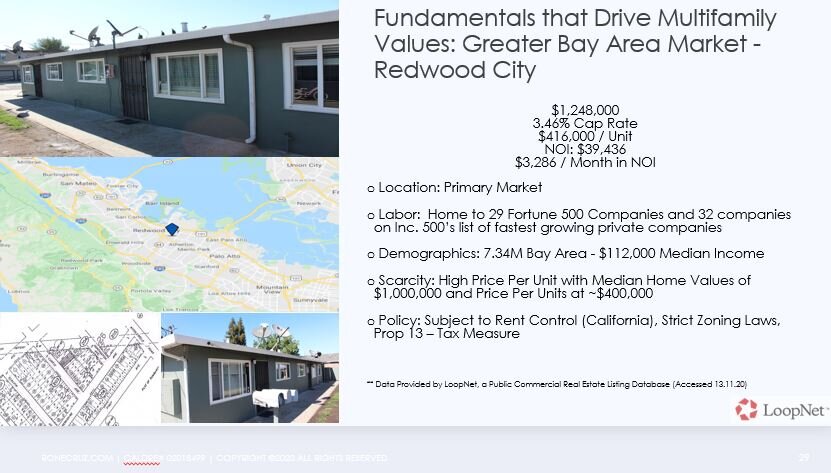
The economic growth drivers of labor and entrepreneurship serve as foundational metrics to high values of real estate within US Gateway markets. The San Francisco Bay Area contains four of the five prominent American tech companies that make up the ubiquitous acronym FAANG (Facebook, Amazon, Apple, Netflix, Google). With the exception of Amazon, Facebook, Apple, Netflix, and Google all have their corporate headquarters based here and are regarded for their generous compensation packages provided for their employees. These large employers recruit and retain talent internationally, adding to the prestigious reputation the Bay Area holds. Silicon Valley, located along the peninsula of the Bay Area, also serves as the home for what is considered the mecca of venture capital – Sand Hill Road. Venture capital is classified as a private equity variant that finances startups and small businesses with high growth potential. Venture investors and associates are opportunistic with their funds and are considered the pinnacle of private wealth. With an abundance of tech firms and venture capital, the Bay Area’s is regarded as a formidable U.S. Gateway market for innovation and thought. Investment management and services company Colliers International released a market report on the Peninsula, Silicon Valley, and San Francisco showing the median household incomes (HHI) within these sub-markets being around $120,000 and rising. With highly regarded employers driving average HHI upwards and the constant recruitment of international talent, residential property values skyrocket due to constant demand to house skilled workers.
The multifamily investment climate within the San Francisco Bay Area command high rents which equate to high property values even during turbulent market conditions. Summer 2020 research conducted by Yardi Voyager, an international cloud-based property management and accounting platform, found Bay Area rents and prices per unit contracting in the wake of the coronavirus pandemic. Despite the contraction, Bay Area’s rent still stands strong at roughly $2,588 which is over 1.5 times the U.S. national average of $1,465. The average price per unit in the Bay Area according to this same report has contracted from $436,142 to $387,519 from Spring to Summer which also notably over the U.S. average. High prices per unit create a dynamic for Bay Area properties to be valued considerably higher than the national average.
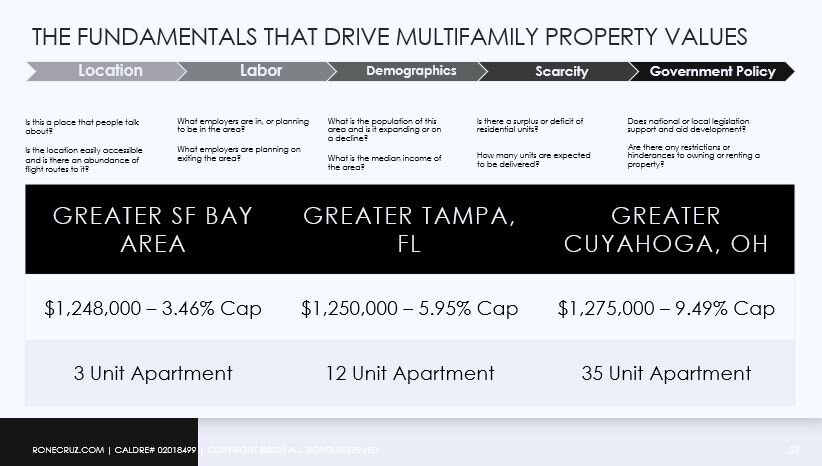
Given these metrics, we can illustrate the price deviation between a generic 40-unit apartment located in a standard market to that of the Bay Area. In most markets, the 40-unit would be valued at $6,000,000 based on a $150,000 per unit national average valuation supported by Yardi and commercial real estate firm Cushman and Wakefield. Utilizing the summer $387,000 per unit valuation, Its Bay Area counterpart is priced at over $15,500,000. With a delta of $9,000,000, property in the Bay Area are priced significantly higher, making investment. We can further expand on this by utilizing the cap rate metric to see a spread between national and major market values. Based on research conducted by the commercial brokerage firm Newmark Group’s Multifamily Capital Markets division, cap rates in a major market like San Francisco gravitate to be 4.7% or less, whereas its non-major market being 5.6% or higher. This 90-basis point spread is only part of the narrative on cap rate compression and value distortion. As we have learned from the research section, assets generally have higher cap rates in proportion to their risk profile, while a lower cap rate indicate an asset less prone to volatility and market disorder.

Slide 36/50 via Presentation
Aside from the high prices and low cap rates, participation in San Francisco Bay Area real estate investment is faced with stringent tenant friendly rulings. The complication of rent control creates an environment where many smaller investors are unable to obtain adequate investment returns. These smaller property owners are both less incentivized and unable to consistently upkeep their properties and provide amenities for their inhabitants. The lack of free working capital slowly pushes property towards statuses of deferred maintenance, creating uncomfortable living conditions for their residents. These smaller investors are eventually placed in a position where they are losing money from owning the property, putting them into a position where they must sell to an investor with greater funding capabilities to prevent further losses. The new owner then generally executes repositioning strategies such as the revitalizing and upgrading the building to cater to tenants who are able to cover the debt and expense obligations of property ownership.

Slide 37/50 via Presentation
Well-funded investors in the San Francisco Bay Area market are able to leverage their capital in a tight market like the Bay Area through the redevelopment of existing rental properties that have underperforming rents due to rent control. Higher-end housing in this market has historically attracted residents that have near 20% higher income than their rental suppressed counterparts in the same zip code. (Diamond, R. et. al, 2019) The redevelopment of units that were formerly under the jurisdiction of rent control create upward pressure on lower rent properties as they become scarcer. With an incontestable supply and demand imbalance, a popular market like the Bay Area only further caters to the well-funded, providing excellent investment returns from repositioning strategies. Ironically, the strict tenant friendly policies do the opposite of what they were intended to originally do, by discouraging the maintenance and upkeep of multifamily properties that have suppressed rents due to rent control rulings. There is a consistent exchange of properties from the smaller investor to the wealthier, as only those with an abundance in working capital are able to benefit from investment opportunity here.
Slide 45/50 via Presentation
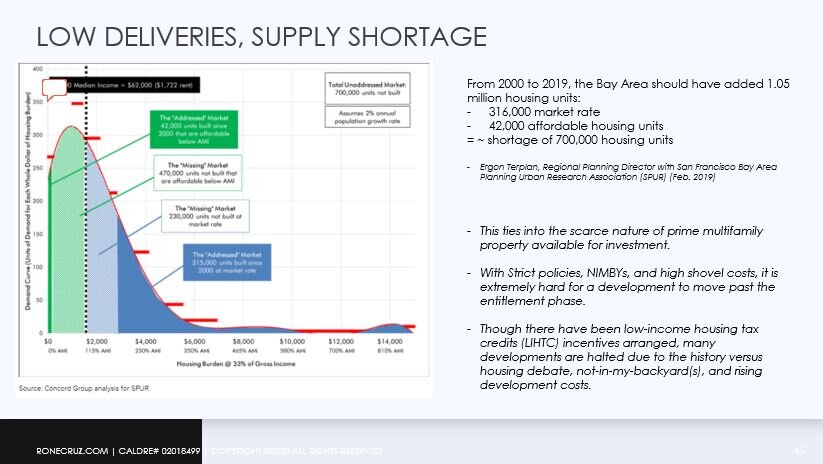
With only heavily funded investment individuals and cohorts being able to participate in redevelopment or the repositioning of assets in this market, there is an extreme dearth in new multifamily product that provides for lower income renters. The slow trickle of new apartment buildings applies upward pressure to the existing rental stock, driving rental rates higher due to the unavailability of residential rental product for consumers.
The disconnect between available affordable and market rent units create a dynamic where apartments under the jurisdiction of rent control, though possessing lower than market rates, also see a premium. Rent controlled units, similar to their market rent counterparts, are in high demand from lower income renters that are willing to pay for space based on the drivers of employment opportunity proximity and generational residence. The subsidized units often have blatant issues of deferred maintenance and are situated in lower-income neighborhoods.
Until the supply problem is solved, demand side measures will not be fulfilled, creating an escalation in value for scarce property. This is an ongoing challenge as the population and wages increase within the Bay Area with the supply of residential housing units lagging far behind the demand.
Concluding Remarks
Slide 47/50 via Presentation
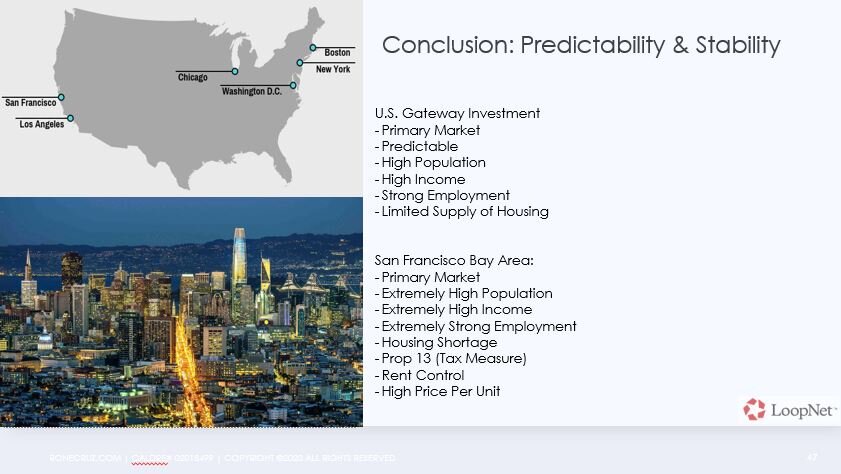
Through our research, we found that there is a premium on multi-unit residential properties in U.S. Gateway markets and that capital being deployed to these markets are fundamentally driven by economic drivers of labor and proximity. At first glance, the high price point is a major deterrence for investors seeking property in these markets. However, with significantly lower volatility than most MSAs as depicted by the compressed capitalization rates, property in the San Francisco Bay Area retain high equity values during turbulent times.
Many U.S. Gateway markets have additional complications to their price premium such as rent control. Though rent control creates an environment that is difficult for the average investor to obtain yield, investment capital still flows abundantly from investors flush with capital due to the innate opportunity of repositioning and redeveloping extremely well-located real estate. The select few who are able to execute these strategies see immediate upside on their investment upon asset delivery to market, providing a high-end experience and amenities to their residents.
Though this research has allowed for a holistic view of multifamily investment motivations in the San Francisco Bay Area, each property prior to acquisition or disposition require an in-depth analysis and underwriting to determine a proper hold and exit strategy. While there are many factors that attribute to the stability of real estate investment within U.S. Gateway markets, more research is needed to determine underlying factors for investment decisions and motivations in the globalized investment property market.

Slide 50/50 via Presentation
References
Basu, K., & Emerson, P. (2000). The Economics of Tenancy Rent Control. The Economic Journal, 110(466), 939-962. Retrieved November 3, 2020, from http://www.jstor.org/stable/2667859
Bates, L.J., Giaccotto, C. & Santerre, (2015) R.E. Is the Real Estate Sector More Responsive to Economy-Wide or Housing Market Conditions? An Exploratory Analysis. J Real Estate Finan Econ 51, 541–554. https://doi-org.libaccess.sjlibrary.org/10.1007/s11146-014-9491- y
Devaney, S., Scofield, D. & Zhang, F. Only the Best? (2019) Exploring Cross-Border Investor Preferences in US Gateway Cities. J Real Estate Finan Econ 59, 490–513. https://doi- org.libaccess.sjlibrary.org/10.1007/s11146-018-9690-z
Diamond, Rebecca, Tim McQuade, and Franklin Qian (2019) "The Effects of Rent Control Expansion on Tenants, Landlords, and Inequality: Evidence from San
Francisco." American Economic Review, 109 (9): 3365-94. https://www-aeaweb- org.libaccess.sjlibrary.org/articles?id=10.1257/aer.20181289
Gagiuc, A. (2020). San Francisco Multifamily Report – Summer 2020. Retrieved October 27, 2020, from https://www.multihousingnews.com/post/san-francisco-multifamily-report- summer-2020/
Geltner, David M. and Alex van de Minne. “Do Different Price Points Exhibit Different Investment Risk and Return in Commercial Real Estate?” The Journal of Portfolio Management 43, 6 (September 2017): 105–119 © 2017 Institutional Investor, LLC
Garcia, K. (2020). US Multifamily MarketBeat: United States. Retrieved October 07, 2020, from https://www.cushmanwakefield.com/en/united-states/insights/us-marketbeats/us- multifamily-marketbeat
Li, J., Liang, X. (2020) Beyond the Cap Rate: Valuation of Multifamily Properties. J Real Estate Finan Econ 60, 99–110. https://doi-org.libaccess.sjlibrary.org/10.1007/s11146-019-09717-9
Ling, D. C., Naranjo, A., & Scheick, B. (2019). Asset Location, Timing Ability and the Cross‐ Section of Commercial Real Estate Returns. Real Estate Economics, 47(1), 263–313. https://doi-org.libaccess.sjlibrary.org/10.1111/1540-6229.12250
Mazur, J., & Wolfson, M. (2020). United States Multifamily Capital Markets Report. Retrieved November 01, 2020, from https://www.ngkf.com/insights/market-report/united-states- multifamily-capital
Shanahan, B., & Garcia, D. (2020). 2020 Fall NorCal Multifamily Market Research Report: Colliers International. Retrieved November 01, 2020, from https://www2.colliers.com/en/Research/Sacramento/2020-Fall-NorCal-Multifamily- Market-Research-Report
Single Family & Multifamily Investment Overview
Residential real estate is the foundation for many investors looking to add real estate to their portfolio. There are many avenues available to investing in residential properties, but the most common is purchasing either Single Family Residences/Houses (SFR/SFH) or Multifamily properties (ownership of an entire apartment complex). Both are excellent opportunities that have their own unique place in investment portfolios and the capital markets. Both Single Family and Multifamily properties have different strengths and weaknesses.
To understand these two types of residential properties, single family and multifamily, we must first define them. Single family homes are essentially single unit properties that are meant to house one family. Single Family residences range from townhouses, condos, conventional houses – the picket fence nuclear family household dream that many speak of. Multifamily is defined as properties that have more than one unit and can house multiple families such as; duplexes, triplexes, fourplexes, a 5-unit, 10-unit, 150-unit and so forth.
Multifamily investments have additional factors to consider, such as the division of financing between the 2-4-unit properties and their 5+ unit counterparts. Multifamily properties in the two to four-unit range (duplex, triplex, and fourplex) allow for a residential loan, and their 5+ unit counterparts require commercial loans. With 2-4-unit properties, an owner has the option to utilize a lower down payment if they occupy one of the units. 5+ unit properties require a commercial loan, bringing up the complication of the Debt Service Coverage Ratio (DSCR), financials of the building, and experience level of the buyer. The DSCR is a metric the lenders use to determine whether or not the income of the property is able to cover the debt service (mortgage) on the property. A DSCR of 1.0 indicates that the property’s cash flow covers the debt service, but most lenders in a normal market require a 1.20-1.25x debt service. The DSCR relays to lenders that the interest from the investment (which is what lenders are most interested in) will be consistently paid, giving them further confidence to fund the loan.
Single Family & Multifamily Investment Property Similarities
- Historically good long-term return on investment
- Larger market of buyers and renters than commercial property
- More consistent during an Economic Crisis
- 4 benefits to real estate investment & beyond.

Some investors prefer to purchase single family properties in bulk and diversify the markets that they invest in.
Single Family Investment Highlights
- Affordability
o Lower up front cost to purchase and much easier flip.
o Lower insurance rates because there is only one unit being covered.
o Utility expenses are fairly manageable as a lot of agreements require the tenants to pay for a higher portion of the utility expenses.
- Appreciation
o More demand for a single family home since there is a greater buyer pool.
o Single-family homes are more subject to supply and demand factors from individuals who want to purchase the property and inhabit it.
o Demand is seldom lacking so home values in primary markets tend to follow a linear appreciation schedule.
- Long Term Tenants
o There is a tendency for single family tenants to view the property as their own in comparison to living in an apartment unit.
o There is less turnover with single family properties, and many SFR tenants look to stay long term and occasionally negotiate a rent-to-own exit.

Multifamily investment allow for multiple residential tenants to pay for rent. In the event there are a couple vacancies, the landlord is not under a ton of stress in comparison to a single family vacancy.
Multifamily Investment Highlights
- Rental Incomes
o Because there are more units, multifamily properties are able to generate higher monthly rental income in comparison to their SFR counterparts.
o An investor can increase their rental income through methods such as renovation, changing the property management team, vending machines, parking spot fees, pet fees, laundry, fitness centers, common area amenities, or RUBS (Ratio Utility Billing Systems).
- Vacancy
o Less vacancy issues. Even if one of the units are vacant for a month or two, the other units are able to supplement the vacancy and pay the debt service (mortgage).
o When an SFR property has a vacancy, the investor still needs to pay the mortgage. This can be out of pocket and last for months on end depending on the location as well as the expectation of the investor. Some investors are unwilling to accept a changing market, and will sit with an overpriced vacancy, further increasing their cash burn.
- Controlling Value - Forced Appreciation
o Because multi-family assets’ values are determined by the income that it produces, the investor is able to force appreciation on the property. This is accomplished through repositioning the asset (also known as rehabbing) or changing out underperforming tenants for market rate ones.
o The forced appreciation strategy allows one to BRRRR apartments (Buy, Rehab, Rent, Refinance, Repeat).
o While SFR properties can get renovated and slightly increase in value, a small rental increase on a multifamily property by $50-$100 a month or a reduction in expenses by 3-5% can unlock tens to hundreds of thousands of dollars in equity upon refinancing.
Additional Considerations
It is critical to consider the marginal costs and benefits to Single Family and Multifamily properties prior to investing. Many Single-Family and 2-4 Unit Multifamily investment properties in the San Francisco Bay Area yield sub 2-3% Capitalization Rates (or simply put, Year 1 return if purchased all cash). Cap rates allow one to quickly determine a property’s return potential, value, and whether or not the property will benefit from financing. High cap rates tend to indicate riskier but greater cash flowing investments, while low cap rate investments indicate stability but are challenging to derive additional value from. Many local investors target Multifamily versus SFR purely off of the increased return. While SFRs have historically performed in the 2-3% range, it isn’t uncommon to see 1.5-3x the rental return with a similarly priced Multifamily property.
Many of the advertised rental numbers on the MLS or the offering memorandums (OMs) for multifamily properties require additional due diligence. An individual skilled in real estate investment advisory should be able to walk someone through the strengths and weaknesses of different properties, identify discrepancies, value-add potential, and present them side-by-side with comparable investments.
Ron E. Cruz
A Quick Guide to Common Area Maintenance (CAM) Charges
What are Common Area Maintenance (CAM) Charges?
Common Area Maintenance (CAM) charges are ubiquitous with commercial property. The common areas of a shopping center, office building, and other multi-tenant properties are maintained through CAM expenses. Some examples of these common areas include lobbies, hallways, elevators, public bathrooms, and public security. These common areas deteriorate due to frequent use and age, so their upkeep is essential to the tenants that occupy the space as well as the customers who frequent these properties. It is common for CAM charges to be settled by the landlord and passed on to the tenant.
There is often a disconnect between the landlords and tenants as what should be included in the CAM section of a lease. Landlords often consider CAM as any and all expenses required to maintain, operate, repair, and manage the property. Tenants view CAM charges with a more holistic and focused view, considering the upkeep of hallways, parking lots, restrooms, and building security.

An office lobby like this is an example of a common area. The cleanliness, furniture, and amenities are factored in to CAM charges.
Common CAM Charges
CAM charges change depending on the asset class (office, industrial, retail, etc.), type of lease (gross, modified gross, or net), and more. Some typical expenses that a landlord can incur and consider a CAM charge to bill the tenant include:
- Maintenance and Repair of Parking Lots
- Trash Removal
- Landscaping
- Janitorial Services
- Pest Control
- Building Security
- Property Insurance
- Real Estate Taxes
- Building Signage
- Common Area Utilities
- HVAC (Heating, Ventilation and Air Conditioning)
- Administrative Fees
- Elevators
- Irrigation Systems
- Window Washing
- Loading Docks,
- Delivery Areas
- Sidewalks
- Driveway
- Renovations
CAM charges are extremely dependent on the landlord, so it is important to inquire on the exact expenses that are to be incurred with the lease.

The benches, plants, and fountains found in this shopping center are all factored in to the tenant’s CAM charges.
Calculating CAM Charges & CAM Complexities
CAM charges are proportional to the amount of space leased by each tenant. To do a quick calculation on CAM charges, a tenant can take their percentage of CAM charges or their pro-rata share and divide their square footage occupied by the gross leasable area (GLA) of the building. This figure will be considered into the tenant’s monthly operating expense so it can be paid during the year.
The landlord will often reconcile the actual CAM charges with the forecasted CAM charges and provide the tenant with a statement. This statement will allow a tenant to view whether they have overpaid or underpaid on their CAM charges. Depending on the scenario, the landlord will either disperse a credit if overpaid or request additional payment in the event of underpayment.
CAM Charges are divided into either: uncontrollable or controllable and cumulatively capped or non-cumulatively capped. Uncontrollable charges would be taxes, utilities, and insurance. Controllable charges would be the remaining items on the list mentioned earlier. Cumulatively capped CAM charges would be where the landlord and tenant agree to an annual percentage of CAM charges, also allowing the landlord to recover a change in CAM charge percent the next year in the event of a delta between the agreed percentage and a CAM charge increase. Non-cumulatively capped (preferred by tenants) is similar to cumulative but is different as landlord is unable to recover the delta on CAM cost increases the following year.

The lots and general area of these loading docks are considered in CAM charges for industrial buildings. If the pavement is damaged, that could affect productivity for all tenants in the space.
Common Lease Structures and their CAM Charges
The most common lease structures would be Gross, Modified Gross, and Net. When considering CAM charges, each lease has different characteristics in regard to considering CAM charges.
Gross: In gross leases, the owner of the asset is responsible for the building’s expenses associated with operation (this includes insurance, taxes, and maintenance). To adjust for these costs, the owner will often factor these charges into the monthly rent to be paid by the tenants.
Modified Gross: The tenant is responsible for some of the operating expenses of the property (negotiable – see above for a list of what could be charged), as well as their normal rent amount
Net: There are various types of net leases (Single, Double, Triple, Absolute), but for the purpose of simplicity, we will be considering a triple net (NNN) lease. With triple net property, the tenant is responsible for all of the operating expenses, taxes, insurance, maintenance, repair, and upkeep of the building as well as their agreed monthly rent.
Recap: CAM Charges
Common area maintenance charges are varying expenses that are up for negotiation. What is considered a common area cost varies depending on the property owner. CAM charges vary by landlord and it is important if one is a tenant to really understand what is included in their CAM charges. It is imperative that one understands a space’s CAM charges prior to the execution of a lease.
Eleven Types of Shopping Centers
Shopping centers come in all shapes, sizes, and configurations. With all the talk about what is going on in the retail industry, it is important to know what type of shopping center your favorite retailer is in to see if they will be affected by the current world happenings. The 11 types of shopping centers are: Neighborhood Centers, Community Centers, Regional Malls, Super-Regional Malls, Fashion/Specialty Center, Lifestyle Center, Power Center, Theme/Festival Center, Outlet Center, Urban Centers, and Mixed-Use Centers. The following characteristics and definitions are from the International Council of Shopping Centers (ICSC).

San Jose Market Center off of Coleman Ave in San Jose, Ca
1. Neighborhood Center: A convenience-oriented center that provides goods (foods, drugs and sundries) and personal services (laundry and dry cleaning, hair styling, shoe repair, etc.) for the day-to-day living needs of the immediate neighborhood. It ranges from 5 to 20 stores and is usually build around a supermarket as the principal anchor. The center typically ranges in size from 30,000 to 150,000 square feet in the United States or from 40,000 to 100,000 square feet in Canada.

New Seasons Market Evergreen in San Jose, California
2. Community Center: A shopping center that contains general merchandise or convenience-oriented offerings. It has a wider range of apparel and other goods offerings. It ranges from 15 to 40 stores and is built around 2 or more anchors such as a discount store, supermarket, drugstore and large specialty discount store (toys, electronics, home improvement, home furnishings, sporting goods, etc.). The center is usually configured in a straight line as a strip, or may be laid out in an "L" or "U" shape, depending on site and design. The center ranges in size from 100,000 to 350,000 square feet in the United States and from 100,000 to 400,000 square feet in Canada. The trade area usually comprises 3 to 6 miles.

Oakridge Mall in San Jose
3. Regional Mall: This shopping center provides general merchandise, fashion-oriented offerings, furniture and home furnishings in depth and variety, as well as a range of services, such as restaurants, and recreational facilities, such as movie theaters. Typically enclosed with inward-facing stores connected by a common walk-way, it is built around 2 or more anchors such as a full-line and/or junior department store, mass merchant, discount department store and/or large-format fashion apparel store. A parking lot surrounds the outside perimeter. Its typical size is roughly 500,000 square feet of gross leasable area; in practice, it may range from 400,000 to 800,000 square feet in the United States or from 300,000 to 800,000 square feet in Canada. The trade area is usually between 5 to 15 miles.

The Great Mall in Milpitas, CA
4. Super-Regional Mall: Similar in concept to the regional mall but offers more variety and assortment. It is typically built around 3 or more anchors such as a full-line or junior department store, mass merchant, discount department store and/or major fashion apparel. A super-regional mall is 800,000 square feet or greater in the United States and Canada, and the trade area usually comprises 5 to 25 miles.

Del Amo Fashion Center in Torrance, CA
5. Fashion/Specialty Center: A center composed mainly of upscale apparel shops, boutiques and craft shops carrying selected fashion or unique merchandise of high quality and price. These centers need not be anchored, although sometimes restaurants or entertainment can provide the draw of anchors. The physical design of the center is very sophisticated, emphasizing a rich decor and high-quality landscaping. These centers usually are found in trade areas having high income levels and were the predecessors of centers now termed "lifestyle centers."

Santana Row in San Jose, CA
6. Lifestyle Center: Typically contains upscale, national-chain specialty stores with dining and entertainment in an open-air setting. It can be anchorless or anchored by 1 or 2 large-format upscale specialty store, a grouping of highly branded stores and/or a cinema. There usually is an emphasis on design, landscaping and outdoor amenities such as decorative fountains and outdoor seating. The center usually ranges in size from 150,000 to 500,00 square feet both in the United States and Canada.

Chino Spectrum Towne Center in Chino, CA
7. Power Center: Contains at least 3 category-dominant anchors, such as discount department stores, off-price stores, wholesale clubs, home furnishings, pet stores, electronics and discount apparel, with only a few small tenants. The narrowly focused but deeply discounted merchandised stores, such as home improvement, discount department, warehouse club and off-price stores, generally occupy 85% or more of the total GLA. The center typically contains a gross leaseable area ranging in size from 250,000 to 600,000 square feet in the United States or from 100,000 to 1,000,000 square feet in Canada. The trade area usually comprises between 5 and 10 miles.

Pier 39 in San Francisco, CA
8. Theme/Festival Center: Has leisure, tourist, retail and service-oriented offerings with entertainment as a unifying theme. Often located in urban areas they may be adapted from older--sometimes historic--buildings and can be part of a mixed-use project. It is typically anchored by restaurants and entertainment venues. The size may vary from 80,000 to 250,000 square feet. Also known as theatre/entertainment center in Canada.

Gilroy Premium Outlets in Gilroy, CA
9. Outlet Center: Manufacturers' and retailers' outlet stores selling brand-name goods at a discount.
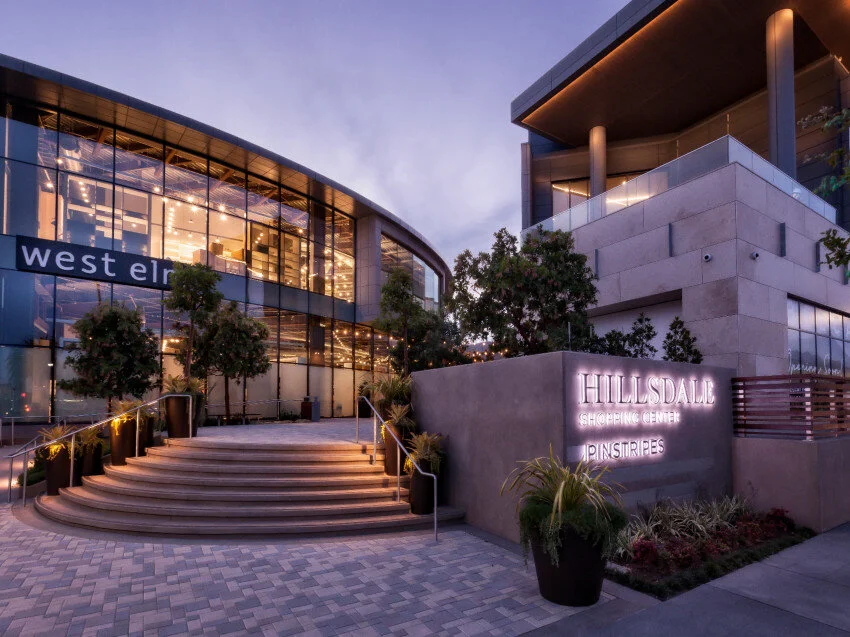
Hillsdale Shopping Center in San Mateo, CA
10. Urban Centers: Contributors to the revitalization of downtown areas, urban centers are usually part of a city's urban-renewal program. They usually include a pedestrian mall or covered walkways (particularly in areas of climate extremes) and are built right in the traditional shopping district. Characteristically, urban centers feature a park-like atmosphere, absence of cars, freedom to move about among a variety of retail stores, and, in many cases, a food court.

Rafael Town Center in San Rafael, CA
11. Mixed-use Center: A center that consists of well-integrated entertainment , office, hotel, residential, recreation, sports stadium, cultural venues, and/or other uses that mutually support a substantial retail component.
4 Benefits to Real Estate Investment
Real Estate holds a special place in an investment portfolio, allowing it to be customizable to one’s risk profile. In addition to the risk customization, real estate has four innate benefits that are often overlooked such as; tax advantages, active cash flow, principal pay down, and appreciation.
Tax Advantages
o There are many unique tax advantages available to those that invest in real estate. Some of the IRS rulings that exist include Internal Revenue Code (IRC) 121 which allows the taxpayer to exclude up to $250,000 ($500,000 for taxpayers who file jointly) on the sale or exchange of property that is used as principal resident for at least two (2) of the five (5) years before the sale. There is also the 1031 exchange, where one can defer their capital gains to their next investment instead of paying capital gains when selling their original investment property. Keep in mind that there needs to be debt on the next property, or one is unable to gain the tax benefits of depreciation.
Active Cash Flow
o When structured correctly, an investor will receive monthly cash flow from the rent that the tenant pays after factoring expenses (management, tax, insurance, repairs, etc.) One of the common ways to figure out one of the ranges one might receive through this would be calculating the cash-on-cash return on the investment. Cash-on-cash return is the annual return that is received in relation to the amount of mortgage paid during that same year. (Cash-on-Cash Return = Annual Pre-Tax Cash Flow / Total Cash Invested with Annual Pre-Tax-Cash Flow = (Gross Scheduled Rent + Other Income) - (Vacancy + Operating Expenses + Annual Mortgage Payments)).
Principal Pay Down
o When executed correctly, the tenants will be paying down the investor’s mortgage or debt service on the property. This effectively lowers the loan and increases the equity of the investor. If the asset is held for an extended period of time, the property may become free and clear!
Appreciation
o There are two primary types of appreciation when it comes to real estate investment; forced appreciation and market appreciation. Forced appreciation is based on the income produced by the asset that the investor has control on (through repositioning the investment or re-tenanting the asset). Market appreciation is dictated by the supply and demand of the asset.
9 Bay Area Counties: Commercial Property Statistics
Having been fascinated by economics at an early age, I have always had a keen interest in knowing what is going on in the varying markets. Through the cross referencing of multiple databases such as CoStar, LandVision, Multiple Listings Service (MLS), Big Brokerage House Data, and Public and Private Investment Firms, I stay up to date with fluctuations and changes to the markets closest and relevant to me.
One of the key elements to understanding a market, whether you are a principal, broker, or speculator, is understanding what makes up the market. I have compiled the general stats of the 9 Bay Area Counties so one can better understand what is saturated and what has room for expansion. With this post, we will be ignoring the single family residential markets, isolating the focus to commercial real estate and its spaces.
Alameda County
San Mateo County
Santa Clara County
San Francisco County
For those that are unfamiliar with the 9 Bay Area Counties, they are:
Sonoma County
Napa County
Solano County
Marin County
Contra Costa County
Santa Cruz County is close, but unfortunately it is part of the 5 Santa Cruz County subdivisions.


In terms of the 9 Bay Area Counties, there are over 144,736 properties and 15,430 spaces recorded on the online databases. There are some properties that are not recorded on these databases, but that number is fairly slim. When looking to invest in a new market or county, it is imperative to know what the competition is like as well as the market climate, drivers, and comparable properties. In this post, we are only going to be going over what is recorded and its commercial real estate asset class allocation. All the values being reported are aggregated from the previously mentioned sites, and made more reader friendly and less excel jargon by me. With a small margin of errors by properties that are not recorded in the multiple data banks, I am confident that this is a fair representation of the 9 counties. This report does not consider the size of each asset (i.e. one apartment being 300 units versus an apartment being 6 units), but is instead a holistic statistic to the 9 Bay Area Commercial Real Estate Markets.


In future posts, we will be going over the strengths, weaknesses, drivers, and possibly some predictions and forecasts of each of the 9 counties.
Ron E. Cruz
Potential Development Site Feasibility Analysis
Running quick analyses allows us to discover whether or not a project would be feasible or profitable enough given the basic zoning rules as well as current market conditions.
Here's an analytical rundown I did for a friend of mine back in November of 2019. They were curious about a listed property, and wanted to better understand one of the many ways to approach a site like this.

Subject:
1991 Colony St. Mountain View, Ca 94043.
- +20,000 SF Lot
- $4,100,000 for the site (Looking at the property as a site versus that of a home) Highest and Best Use would be the key verbiage that a broker would use.
This would be a Highest and Best Use style Analysis:


Because the client is a developer, we must do a quick check on the zoning in terms of what we can and cannot send them. If you send them properties that are not underwritten or you do not know the whole story generally, you may lose the client or they'll stop picking up your calls / blacklist you.
Zoning:
The Zoning states that the property is R3-2 for the address. We can now check what this supports given that the property is a 20,000 SF lot and we're doing a highest and best use analysis. The property is zoned residential so that would make it attractive for a residential developer.
Upon further research, we can see that 20,000 Square feet can support (You have to scroll but I just took a screenshot unfortunately), 5 units to be developed with a 16,000 SF lot in terms of an R3-2 Zoning code. Each additional unit would require the other highlighted metric of 2,000 SF. 16,000 SF + 2,000 SF + 2,000 SF = ~20,000 SF or a total of 7 Units to be developed to stay within zoning code for our developers.
We then can assess what the current market would be willing to pay for 7 Units:

There are only 29 properties that fit the 7-unit criteria that exist in Mountain View and with a housing crisis, this is good news for us. This would show that we can potentially deliver 7 units and have it be approved. With Multifamily being a popular product type as well as a one of the 4 core commercial real estate classes, there is a demand for more units versus one 5-bed/4-bath Single Family Home
Diving deeper, we can see that:

Conclusion:
The average price per door is $624,000 per door. We can then multiply that by the 7-units in our project to get $4,368,000 as the current market value of the property upon delivery.
With the cost of the project being $4,100,000 and the delivery being worth $4,368,000, there is only a $268,000 spread and we have not included the cost of development as well as calculating the NPV (Net Present Value - what the final project would be worth today), Sensitivity Analysis (to see how the market would react to the delivery of more units as well as potential outcomes in a possible recession), the Projected Hold Period (factoring how much holding period would affect our client's development), and the last basic, Entitlement and Labor Costs (one really needs to be well capitalized for this).
For many of these reasons that were not factored in, the project is currently overpriced and it would be rather rough to continue going into "what-if" analysis when the spread is only $268,000.
The other option in terms of analysis would be a checking what compliments the developers' recent projects. Seeing how they have completed multiple transactions in the 100's+ of units in the Bay Area, a project that would only allow them to deliver 7 units would not seem that attractive and with theory of mind in place, we are able to understand that they would want a project that can compliment more density (i.e. 20+ units or so).
A small plot of land may work if the zoning supports high density, but unfortunately this site does not have that zoning.
Recap:
Running a brief analysis and walking someone else through the process was really helpful to improving my articulation in regards to situations like this. The development group was ideally looking for something with the potential for a high density multifamily development, but unfortunately this site did not make the cut.
Ron E. Cruz
Introduction to Net Lease
Net Lease investments are coveted as one of the leading options for investors seeking commercial real estate when it comes to passive income and consistency. Net lease properties perform similar to bond securities, with predictable payout structures through the lease, ratings of investment grade or non-investment grade in terms of the tenant, and sometimes protections through corporate or franchisee guaranties, protecting the landlord’s income in the event of unforeseen circumstances.
Investments in this sector have varying lease structures, with the most common being a Triple Net lease (NNN). Triple Net leases are classified as leases where the tenant pays rent to the landlord as well as the property insurance, property taxes, and building maintenance. Many investors purchase these assets to avoid the common “Three T’s” of active real estate ownership, Tenants, Toilets, and Trash. An investment in net lease property can provide stable and hassle-free monthly income through even the most volatile of markets.
Net lease investments range from all the major commercial real estate asset classes of office, retail, and industrial, with the most ubiquitous being retail. Retail net lease investments have many sub-sectors including Banks, Big Box, Drug Stores, and Restaurants to name a few. Each sub-sector can be broken down further, each with different strengths, weaknesses, and performance characteristics.
When we look at restaurants, there are three major types, Quick Service Restaurants (QSR), Casual Dining, and Fast Casual. QSRs are the proper term for “fast food” establishments, with prime examples being McDonalds, Burger King, KFC, and Taco Bell. Casual Dining would be what most consumers consider a normal restaurant such as Chili’s, Olive Garden, and Red Lobster. Fast Casual is the blending of QSRs with Casual Dining exemplified by Five Guys, Panera Bread, and Chipotle.
Understanding the key performance indicators of a Net Lease investment is imperative to being a successful owner or investment real estate broker. Though Net Lease assets tend to be considered recession proof, there are still inherent risks, requiring a specialist’s analysis prior to acquisition. With many options to choose from and risks to be considered, it is important to consult with professionals that specialize in Net Lease prior to making a purchase or executing a transaction.
Ron E. Cruz